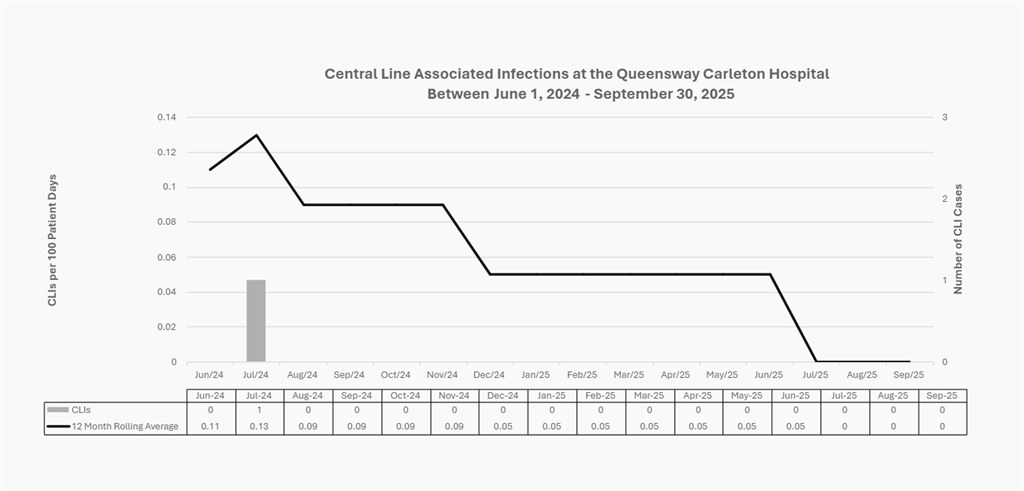
When a patient requires long-term access to medication or fluids through an IV, a central line is put in place to provide easy access to a vein. It is placed into a large vein in the neck, chest, groin, arm or abdomen. This is used instead of having to frequently insert needles for treatments such as chemotherapy, antibiotics and intravenous fluids, and feeding, or to take samples of blood for testing.
A central line blood stream infection (CLI-BSI) can occur when bacteria and/or fungi enters the blood stream, causing a patient to become sick. The bacteria can come from a variety of places (e.g., skin, wounds, environment, etc.), though it most often comes from the patient’s skin.
Hospitals follow best practices on how to prevent bacteria from entering into a central line. Patients in the Intensive Care Unit (ICU) often require a central line since they are seriously ill, and will require a lot of medication, for a long period of time.
More patient-specific information is available at Ontario Ministry of Health and Long-Term Care website.
In Ontario, all hospitals with ICUs are required to report into the Critical Care Information System (CCIS) – a centralized data collection system where hospitals report a variety of critical care information. Included in the data is the CLI rate.
These Ontario hospitals are posting their quarterly CLI-BSI rate and case count for those infections acquired in their facility, using the following formula:
total # of ICU related CLI-BSIs after 48 hours of central line placement x 100
total # of central line days for ICU patients 18 years and older
Central Line Infection Rates 2024-25
